A friendlier visualization of Java's JIT compiler based on control flow
The previous post introduced the Ideal Graph Visualizer (IGV), a tool to visualize the inner workings of OpenJDK’s main just-in-time compiler. This post focuses on a new IGV feature, to be released in OpenJDK 19, to make it easier for compiler experts to maintain and extend the compiler and for advanced Java users to get a grasp of it.
The rough sea of nodes
OpenJDK’s main just-in-time (JIT) compiler, called C2, represents the program under compilation using a program dependence graph (PDG). In a PDG, nodes correspond to operations and edges correspond to dependencies among operations. The distinguishing feature of PDGs is that they unify data and control: nodes correspond to ordinary arithmetic/logic operations but also to control operations such as conditional jumps and loops. The PDG flavor used in C2 is often referred to as the “sea-of-nodes”. This is the PDG of a simple loop with two exits:
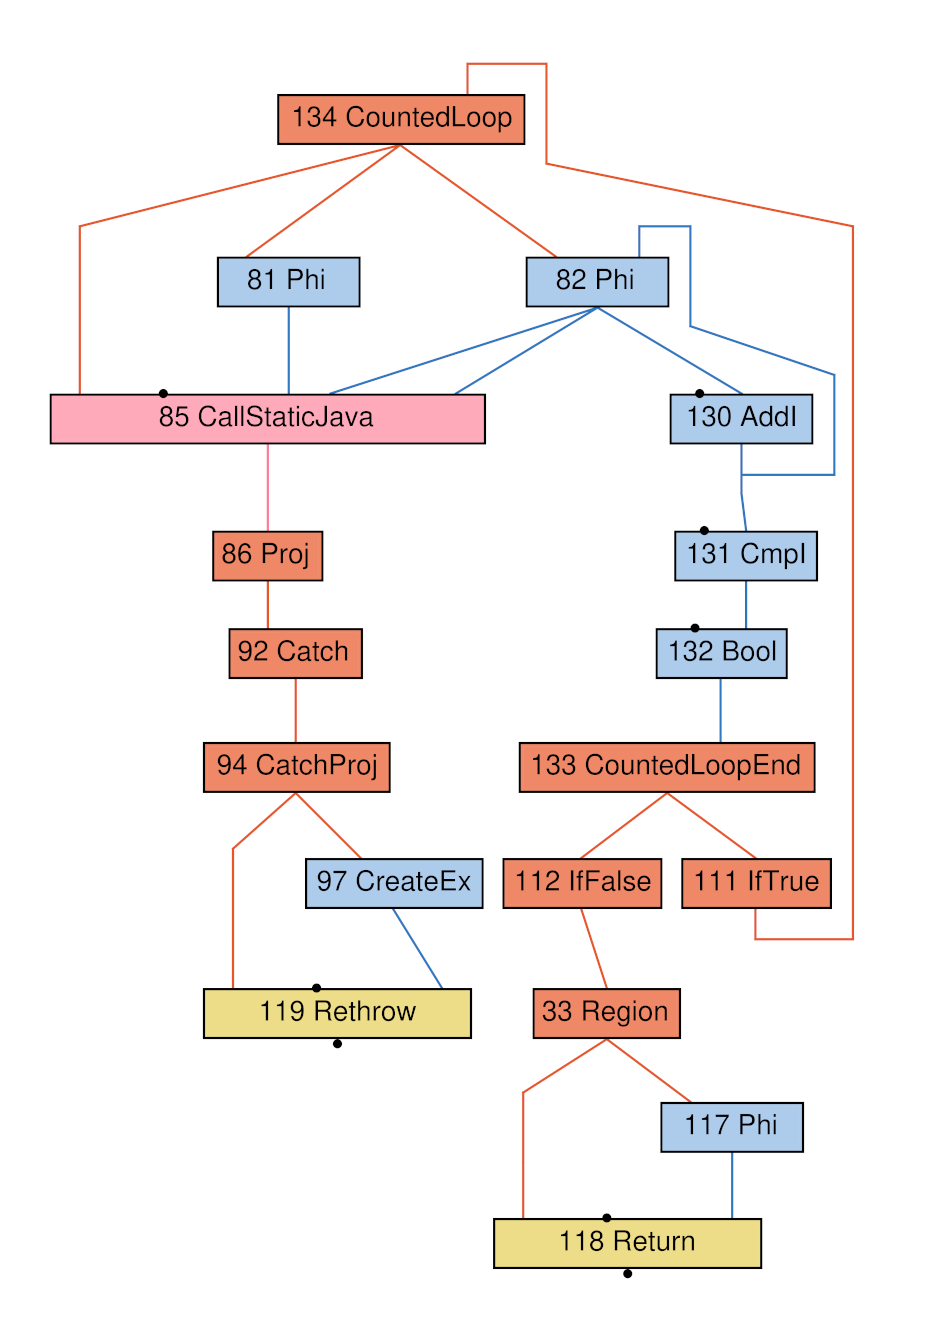
PDG of a simple loop with two exits
The unified nature of the sea-of-nodes representation eases the implementation of a number of optimizations, but has a significant drawback: even graphs corresponding to relatively small programs turn quickly into a tangle (a “sea of nodes”) that is quite difficult to grasp. In the words of John Rose, one of the main architects of the OpenJDK’s virtual machine: “Engineers (…) usually cannot read PDG graphs directly without assistance; this affects debugging speed”.
From program dependence graphs to control-flow graphs
The most commonly used program representation in compilers is probably the good old control-flow graph (CFG). In a CFG, nodes correspond to basic blocks (sequences of operations that are always executed together) and edges correspond to control jumps across basic blocks. Unlike PDGs, CFGs explicitly assign a basic block to each operation and order the operations within each basic block. This increases the complexity of several compiler optimizations, but yields a structured, sequential view of the program that is easier to understand and debug. Furthermore, CFGs are a familiar abstraction for many systems engineers, whereas PDGs remain an obscure topic in advanced compiler courses.
Inspired by feedback gathered from many C2 engineers across different organizations and by John Rose’s call to arms (“Even in a PDG, debugging presentations can easily include trial schedules to be competitive with CFG presentations”), I have developed a new IGV view that presents C2’s PDG-based program representation as a CFG. The new IGV view computes its own “trial schedule”, including an assignment of operations to basic blocks (global schedule) and an ordering of operations within each basic block (local schedule). The trial schedule is replaced by C2’s actual schedule when this becomes available during the last compilation phases of C2. This is the classic PDG view and the new CFG view of a simple method:
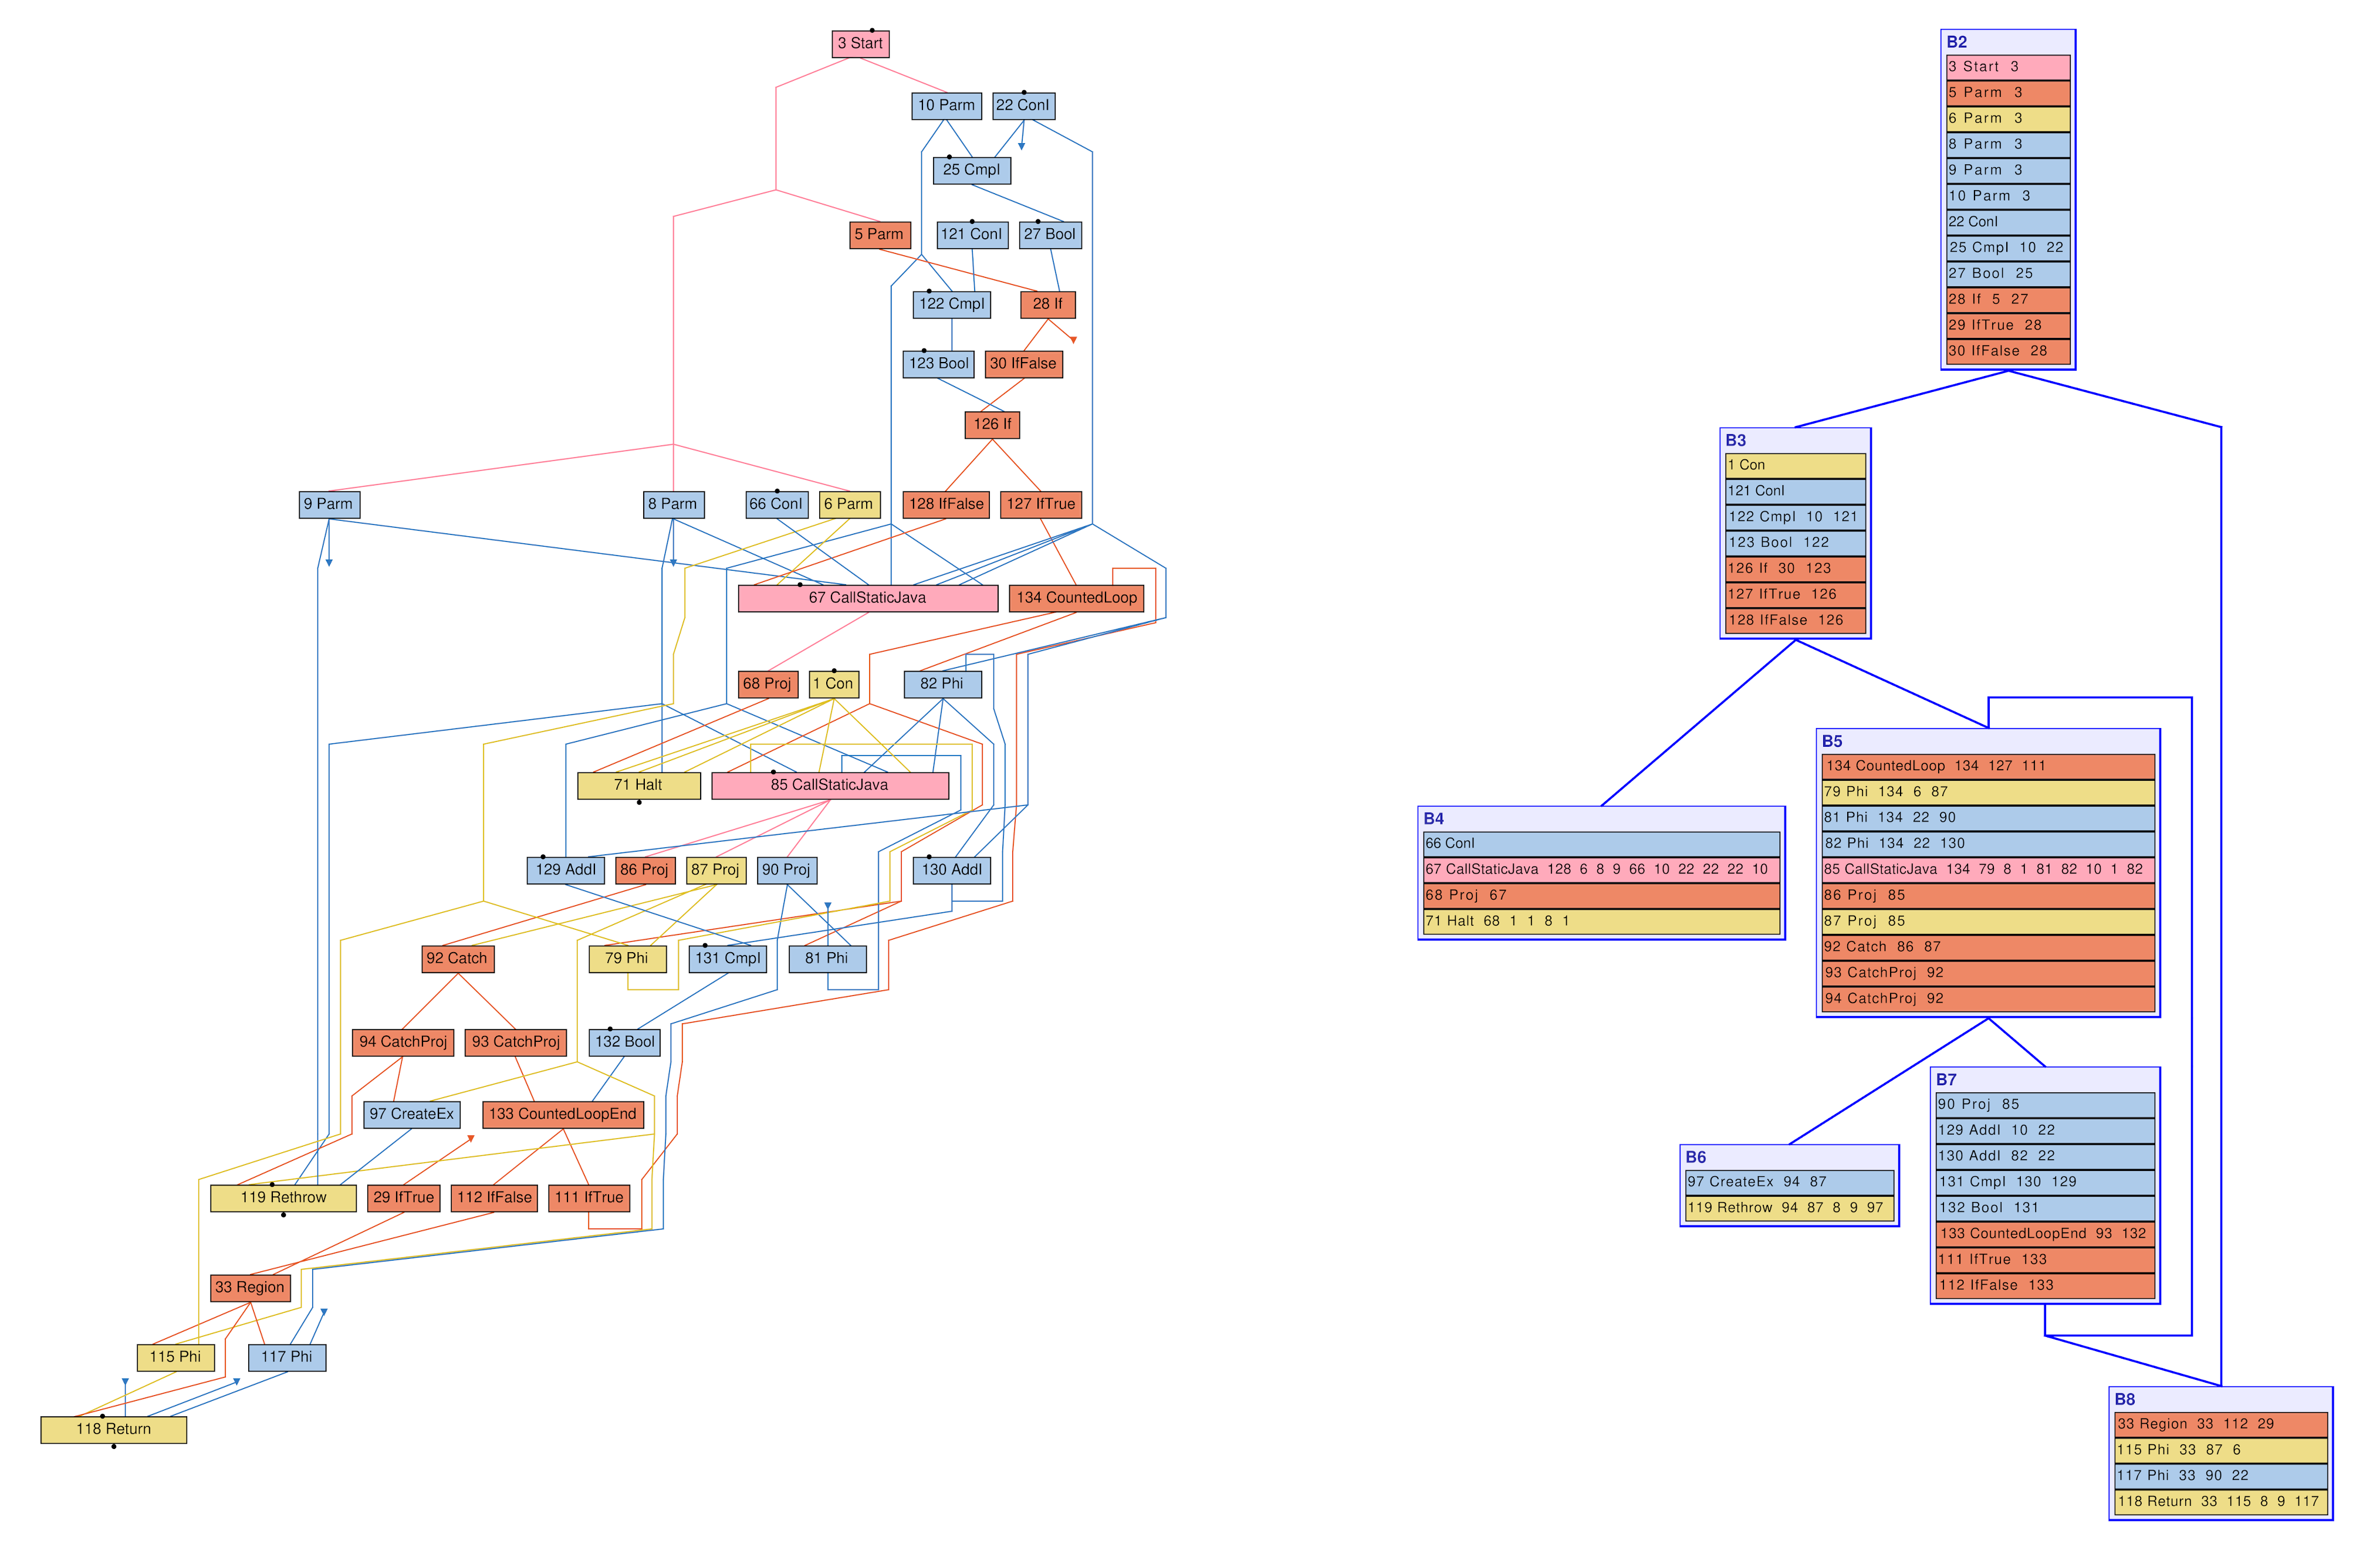
PDG (left) and CFG (right) of a tiny Java method
Trying it out
If you want to explore further, you can try out the new view using the above example in a few simple steps:
-
Download the OpenJDK source code (IGV builds are not distributed with the JDK):
wget https://github.com/openjdk/jdk/archive/refs/heads/master.zip unzip master.zip -
Build IGV using Maven:
cd jdk-master/src/utils/IdealGraphVisualizer mvn install -
Run IGV:
sh igv.sh -
Open this IGV graph file (
File→Open...).To produce your own graph file
foo.xmlinstead, run a debug build of the virtual machine with the options-XX:PrintIdealGraphLevel=3 -XX:PrintIdealGraphFile=foo.xml. See IGV’s usage instructions for more detail. -
In the
Outlinewindow, expand theexample graphsgroup and double-click ongraph. By default, the PDG view is shown. -
Switch to the CFG view by clicking on the following Toolbar button:

Now that you have a copy of IGV’s source code on your hands, it is a good moment to remind that there are multiple “starter” tasks proposed to improve the tool, and contributions are welcome! Hacking IGV is a friendly way of learning how C2 works and getting your hands on the OpenJDK project in general.
Possible extensions
Are CFGs the final word in compiler visualization? Hardly! There are many ways in which IGV could be extended to make it more useful for compiler developers. Here are some ideas:
-
Visualizing program regions. Programs have more structure than raw basic blocks. IGV could improve top-down exploration by clustering basic blocks into (nested) loops, if-then-else structures, etc.
-
Estimating execution frequencies. Basic block execution frequencies can provide a very powerful visual aid to quickly identify the program regions that “matter” (basic blocks that are executed most often). Currently, IGV colors blocks by execution frequency only if the information is provided as part of the input, but it could be extended to perform the analysis itself, similarly to how it is done with scheduling information.
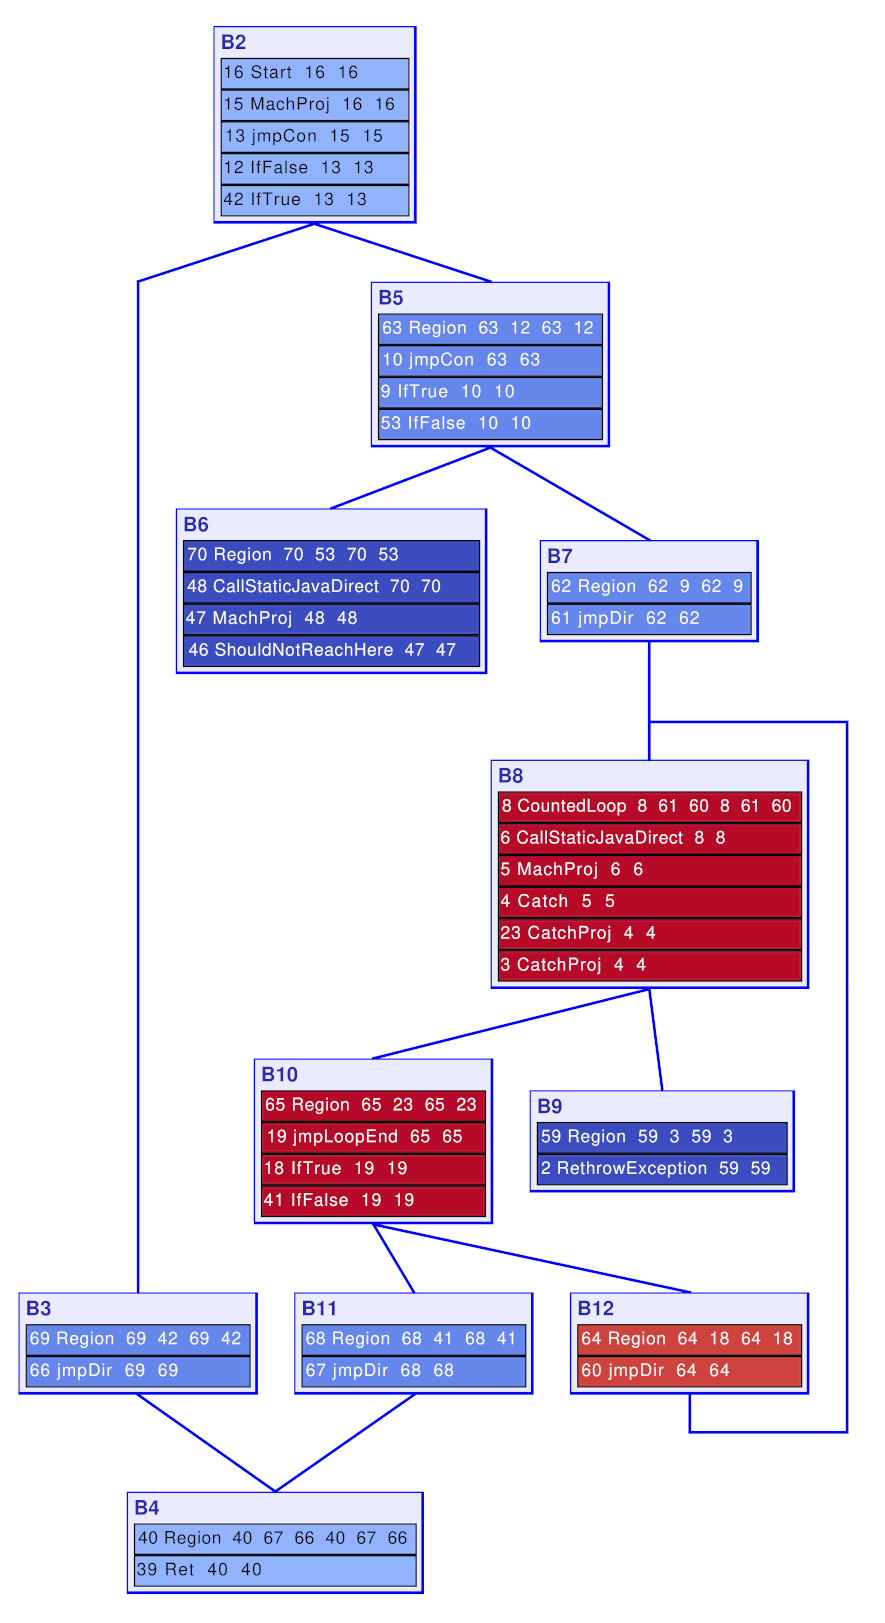
CFG colored by execution frequency (cold blocks in blue, hot blocks in red)
- Visualizing CFG-based compilers. Until now, IGV had been limited to compilers using a PDG representation, but thanks to the new view, CFG-based compilers (for example C1, OpenJDK’s lightweight JIT compiler), could also benefit from it.
Other improvements in JDK 19
Besides introducing the new CFG view, IGV has been upgraded to JDK 17 and made faster than ever (bringing in average speedups of 15x and 2.4x for scheduling and viewing graphs).
If you have feedback, questions, or want to discuss any of the above ideas, talk to me!
Acknowledgements: thanks to Jesper Wilhelmsson and Vladimir Kozlov for providing feedback on an earlier version of this post.