Uncertainty Wednesday: Beliefs (Cont’d)
Last Uncertainty Wednesday, I introduced the idea of beliefs. Today we will make this idea more precise. We started with an extreme belief, the one that a coin is so biased that we will only observe “heads” (H). More realistically one might belief that a coin is fair, but has some possibility of being slightly biased in either direction (e.g., more likely to observer H or more likely to observe T).
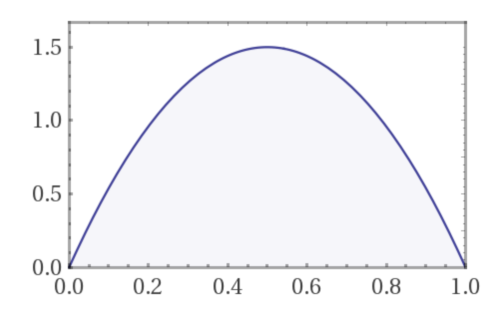
So how do we formalize this? A belief is simply a probability distribution. For instance the one we just described might be modeled as follows where the horizontal axis shows the values of p from 0 to 1 (where p is the probability of observing Heads)

This is a distribution with a mean at p = 0.5 where the probability decreases to 0 on either extreme (meaning at p = 0 and at p = 1).
The chart is the probability density function (pdf) for the beta distribution with parameters alpha = beta = 2. You might wonder why the graph goes to values above 1, which would seem to suggest probabilities > 1, but the whole area under the curve is exactly 1. Probabilities are derived from the pdf as small slivers around a value of p (the horizontal axis). For instance between p = 0.45 and p = 0.55 if you imagine vertical lines you get an area of approximately 0.1 * 1.5 = 0.15. So with this belief we are saying that the coin has about a 15% chance of being pretty fair.
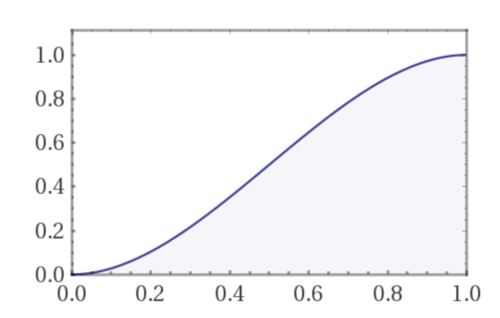
Another way to show this belief is via the following cumulative distribution function (cdf):

For each value of p along the horizontal axis, the cdf shows the integral of the pdf from 0 to that value of p, where p = 0.5 represents a fair coin. Looking at it this way we can see how much probability we attribute to the coin being less or more biased than a specific value of p.
Contrast this with a belief that the coin is precisely fair, which would have a cumulative distribution function that looks like this instead:

Here the entire probability is concentrated on p = 0.5! We believe with 100% certainty that the coin is exactly fair. We attribute no probability to it being biased in either direction. The bottom horizontal line ends at 0.5 with a blank circle ○ and the top horizontal line starts at 0.5 with a solid circle ●, indicating that the value of the function jumps from 0 to 1 at 0.5. So why not draw a probability density function? The reason is that technically we would have to show something different, namely a probability mass function.
At a later point we will see just how extreme such a belief is, but even just looking at a discontinuous function should provide an inkling of that.
Posted: 2nd May 2018 – Comments
Tags:
uncertainty wednesday beliefs
